
The twenty strategy cards, counted
In brief
cTrader's pages for gold, bitcoin and the euro each show strategy cards, and across the three pages the same 20 cards appear. This page counts them by four questions a reader can put to a card: how old, what to start, what traded, what the short curve did. It names no provider and no strategy, ranks nothing, and does not say any card is worth following.
Where the twenty come from
The front page of cTrader Copy counts strategies and providers in the hundreds in its header; the three symbol pages that this site read show 20 cards between them. The twenty are not described as a sample of the hundreds, and the pages do not say how they were chosen. Every count below is therefore a count of these twenty on the day, and says nothing about the whole list. The help page on the strategy list adds that it includes only strategies whose providers are currently trading.
How old the cards are
Age is counted from the creation date on each card to 6 November 2026. Source: ctrader.com/copy/symbols (gold, bitcoin and euro pages), read on 6 November 2026.
| Age of the strategy | Cards |
|---|---|
| Younger than 100 days | 4 |
| 100 days to under a year | 8 |
| A year or more | 8 |
What the ages show
The youngest card is 49 days old and the oldest 1,369. 12 of the 20 are under a year old. A card that is a few weeks old has a record of a few weeks, whatever return is printed beside it, and the pages do not say over what period a card's printed return is measured.
What the cards ask to start
The minimum investment is printed in US dollars on each card. Source: ctrader.com/copy/symbols (gold, bitcoin and euro pages), read on 6 November 2026.
| Minimum investment | Cards |
|---|---|
| USD 100 or less | 6 |
| USD 101 to 500 | 9 |
| USD 501 to 1,000 | 3 |
| More than USD 1,000 | 2 |
What the minimum means
Minimums run from USD 100 to USD 50,000. The help page defines the minimum investment as the least amount an investor can allocate, and adds that funds cannot be withdrawn if that would take the equity below the minimum while copying. The minimum is therefore a floor on the money that stays in, and not only a price of entry.
What the cards have traded
Each card lists the symbols its provider has traded. Across the 20 cards 19 different symbols appear. Source: ctrader.com/copy/symbols (gold, bitcoin and euro pages), read on 6 November 2026.
| Symbols listed on the card | Cards |
|---|---|
| 1 symbol | 11 |
| 2 symbols | 3 |
| 3 symbols | 3 |
| 4 symbols | 1 |
| 10 symbols | 2 |
| Cards listing XAUUSD (gold) | 15 |
What the symbols show
15 of the 20 cards list gold among their symbols, and 11 list a single symbol. One symbol is listed by many cards and the rest are spread thin: 19 different symbols across twenty cards. A card that lists one symbol and a card that lists several are different things to follow, but the symbol list says only what has been traded and nothing about how. Several cards on the same symbol hold positions on the same price, which matters for what a follower would be holding if two of them were copied.
What the 29-day curves did
Each card draws a curve of 29 daily points from 8 October 2026 to 5 November 2026, starting at 0. The table counts where each curve ended and its largest fall from an earlier point, in the curve's own unit (points). Source: ctrader.com/copy/symbols (gold, bitcoin and euro pages), read on 6 November 2026.
| Where the curve ended | Cards | Largest fall inside the curve | Cards |
|---|---|---|---|
| Below zero | 5 | No fall | 6 |
| 0 to 10 | 5 | Up to 5 points | 9 |
| Over 10 to 50 | 7 | 5 to 10 points | 1 |
| Above 50 | 3 | More than 10 points | 4 |
What the curves show, beside the printed returns
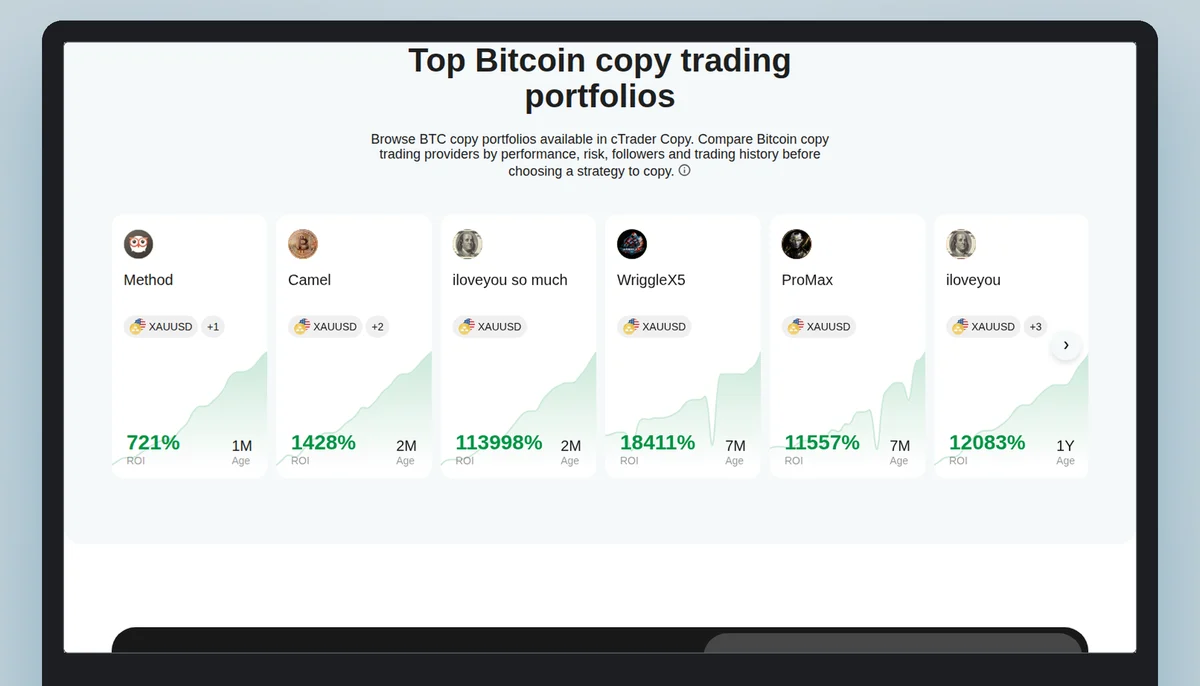
5 of the 20 curves ended below zero and 15 ended above it. The printed returns run from -17% to 113,998%, and 8 of them are 1,000% or more, of which 5 sit on cards under a year old. 2 cards print a negative return. The return and the curve are different measurements: the curve is 29 days, the return's period is not printed. Reading the two together is only a way of counting, and it supports no claim about any strategy.
What a follower would not see in these counts
The cards show the provider's account. A follower's account differs by fees, by prices at entry, by the time copying started and by the broker's size limits, as the page on mechanics sets out. A card's curve cannot show what a follower with a smaller account or lower leverage would have had.
Read next
Questions a UAE reader asks about copying
Were the twenty chosen for being good?
The pages do not say how the twenty were chosen, and this site ranks nothing.
Is a very high printed return a result a follower got?
No. It is the provider's figure as the card prints it, with no period stated.
Why count by age?
Because a record is only as long as the strategy is old, and the card prints both.
Does a curve ending above zero mean the strategy is sound?
No. It is 29 days and a count of where they ended.
The broker this site links to
This site links to FxPro, which cTrader's list marks as a copy-enabled broker. A copied trade is a leveraged contract on a price, not ownership of anything. Read the terms before you decide anything.